
This document details the way data that have been collected through DSIDE_REPLAY PL/SQL package can be used to generate HTML reports, with DSIDE_REPORT PL/SQL package.
Reporting architecture #
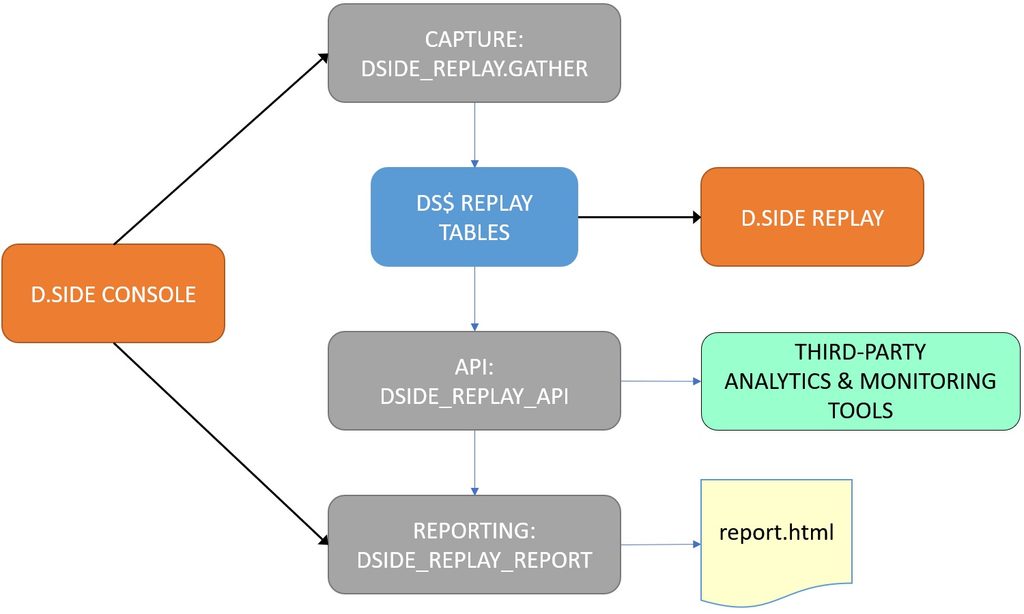
d.side Reporting module is based on d.side Interactive Replay feature.
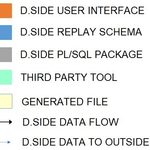
Replay gathering job is in charge of taking snapshots of Oracle activity. These snapshots are stored in the dedicated REPLAY schema. New Reporting module calls API functions to read this schema’s content and generate HTML reports.
Installation #
Once d.side Interactive Replay schema has been created using the usual dscreate.sql script,
Reporting module specific components like tables or packages can be created in this schema.
Ensure you are connected with your Replay schema, and
1. run the following scripts #

to upgrade your REPLAY schema with Reporting components:
@dsreplay_api.sql
@dsreport.sql
These scripts are part of d.side_home/d.side_scripts directory.
More details about d.side Replay installation.
2. ensure following files are located in reports directory #

where you are going to generate your reports. Default is d.side_home/reports:
chart.js
chartjs-plugin-annotation.js
d.side_logo.png
The aim of these files is not to help generating your reports but to be able to read them.
Without these files you can generate reports but you won’t be able to read them, or they could appear almost empty.
What a report is and contains #
A report is a HTML file, easy to open, convert to PDF and share.
A report can contain any chart like CPU usage, IOs, number of sessions or transactions…
It also can contain main wait events list or main SQL queries list based on their Oracle consumption.
Creating a report #
Creating a report is very easy.
There are only 3 steps to be performed:
- Specify the period to be reported.
- Add components to your report: chart (CPU, transactions…) or list (SQL queries, wait events).
- Generate report into a HTML file.
These steps have to be issued and ordered from an Oracle session connected with your Replay user.
Note: for more comfort, these steps are embedded in d.side Console, to allow the user to generate a HTML report in a few clicks.
1. Specify the period #
The first thing to do when creating a report is to choose the period to be processed.
To do that, just call the INIT_REPORT procedure from DSIDE_REPORT package.
This procedure can be executed using dates or Replay snapshots.
When using dates, the end date can be omitted. In that case the report ends at SYSDATE.
This can be useful when automating report generation within a script.
Example 1, prepare a new report for a given interval:
DSIDE_REPORT.INIT_REPORT (
TO_DATE(‘03/MAR 22:30’, ‘DD/MON HH24:MI’),
TO_DATE(‘04/MAR 04:00’, ‘DD/MON HH24:MI’)
);
Example 2, prepare a new report covering the last 7 days until now:
DSIDE_REPORT.INIT_REPORT (SYSDATE-7);Example 3, prepare a new report for the period between Replay snapshots 500 and 600:
DSIDE_REPORT.INIT_REPORT (500, 600);2. Add components #
Once the period has been selected, add every component you’d like to see in your report.
Components are of two types: list or chart.
Add a list #

To add a list in the report, just use one of these procedures:
DSIDE_REPORT.ADD_TOP_SQL;
DSIDE_REPORT.ADD_TOP_WAIT_EVENTS;
These procedures allow to specify the “top” number. By default, reports include top 10 SQL queries or top 10 wait events when invoking these procedures without “top” value.
Example 1, add in your report the 5 SQL queries consuming most elapsed time in Oracle:
DSIDE_REPORT.ADD_TOP_SQL (5);Example 2, get in your report the 10 events Oracle sessions were waiting on:
DSIDE_REPORT.ADD_TOP_WAIT_EVENTS;
Add a statistic chart #

To add a chart, just use the ADD_CHART procedure:
DSIDE_REPORT.ADD_CHART (statistic_name);This procedure requires the name of the statistic to be displayed.
Example 1, add host CPU usage:
DSIDE_REPORT.ADD_CHART (‘HOST_CPU’);Example 2, add the number of transactions:
DSIDE_REPORT.ADD_CHART (‘USER_COMMITS’);For more details about statistics that can be used for a chart, refer to the ADD_CHART procedure.

3. Generate HTML report #
After having initialized the report with a valid period, and added all desired components, running the GENERATE_REPORT procedure will generate HTML lines to be spooled into the report file.
set serveroutput on
begin
DSIDE_REPORT.GENERATE_REPORT;
end;
/
For better results, we recommend to specify the following attributes to sqlplus before running the GENERATE_REPORT procedure:
set linesize 1000
set pagesize 0
set trimspool on
set feedback off
And to avoid unexpected text at the beginning of the generated HTML report, we also recommend starting sqlplus in “silent” mode.
For example:
sqlplus -s REPLAY_USER@connection_stringSample script #
Here is an example of script that can be reused to generate a report into myreport.html file:
sqlplus -s REPLAY/password@DBALIAS

set serveroutput on
set linesize 1000
set pagesize 0
set trimspool on
set feedback off

spool myreport.html

begin
DSIDE_REPORT.INIT_REPORT(TRUNC(SYSDATE-3));
DSIDE_REPORT.ADD_CHART('DB_TIME');
DSIDE_REPORT.ADD_CHART('HOST_CPU');
DSIDE_REPORT.ADD_TOP_WAIT_EVENTS(5);
DSIDE_REPORT.ADD_CHART('EXECUTE_COUNT');
DSIDE_REPORT.ADD_CHART('USER_COMMITS');
DSIDE_REPORT.ADD_TOP_SQL();
commit;
DSIDE_REPORT.GENERATE_REPORT;
end;
/

spool off
DSIDE_REPORT package details #
DS$REPORTS table: where reports are stored #
When installing reporting module using dsreport.sql script, DSIDE_REPORT package is created with a DS$REPORTS table. Each generated report is stored in this table.
Here is the DS$REPORTS table structure:
Name                       Type
-------------------------- ----------------------------
REPORT_DATE                DATE
REPORT_NAME                VARCHAR2(64)
PART_ID                    NUMBER
BLOCK_ID                   NUMBER
CONTENT_ID                 NUMBER
REPORT_CONTENT             VARCHAR2(4000)
This table can be queried using the GET_REPORT_LINES function. It also can be purged (DELETE) using REPORT_DATE or REPORT_NAME for example.
DSIDE_REPORT package provides procedures and functions for generating reports and managing the steps to create a report: initialization, components choice and HTML report file generation.
Here is a summary of DSIDE_REPORT procedures and functions:
| Name | Type | Description |
|---|---|---|
| INIT_REPORT | Procedure | Initialize report period |
| INIT_REPORT | Function | Initialize report period and return report name |
| ADD_CHART | Procedure | Add a statistic chart to the report |
| ADD_TOP_SQL | Procedure | Add top SQL queries list to the report |
| ADD_TOP_WAIT_EVENTS | Procedure | Add top wait events list to the report |
| GENERATE_REPORT | Procedure | Display report lines that can directly be spooled |
| GET_REPORT_LINES | Function | Get report lines in SQL, not through dbms_output |
INIT_REPORT procedure #
This is the first step to create a report. It allows the user to define the time range that will be covered in the report.
Syntax
DSIDE_REPORT.INIT_REPORT(
  begin_snap IN NUMBER,
  end_snap   IN NUMBER
);

DSIDE_REPORT.INIT_REPORT(
  start_date IN DATE,
  end_date   IN DATE
);
Parameters
| Parameter | Description |
|---|---|
| begin_snap | First snapshot number to be included in the report period |
| end_snap | Last snapshot number to be included in the report period |
| start_date | Starting date and time of the report period |
| end_date | End of the report range Default: SYSDATE |
INIT_REPORT function #
Syntax
DSIDE_REPORT.INIT_REPORT(
  start_date IN DATE,
  end_date   IN DATE
)
RETURN VARCHAR2;
Parameters
| Parameter | Description |
|---|---|
| start_date | Starting date and time of the report period |
| end_date | End of the report range Default: SYSDATE |
This INIT_REPORT function returns the name of the report that is currently being created.
Example:
variable reportname varchar2(64);
begin
  :reportname:=DSIDE_REPORT.INIT_REPORT(SYSDATE-1);
end;
/
print reportname
ADD_CHART procedure #
This procedure is called when the user wants an Oracle statistic to be plotted in the report.
Syntax
DSIDE_REPORT.ADD_CHART(
  statname IN VARCHAR2
);
Parameters
| Parameter | Description |
|---|---|
| statname | Name of the statistic to be drawn in the report |
Statistics that can be added as a chart in a report are coming from the API. That means every API function with a name starting with “GET_” can be used:
– if it requires (BEGIN_SNAP, END_SNAP, INSTANCE) arguments
– and if it returns a (SNAP_ID, SNAP_DATE, VALUE) set of rows.
So, here is the list of valid statistic names to be passed to this procedure:
| BUFFER_CACHE_SIZE | LOGICAL_READS | USER_COMMITS |
| DB_CPU | PHYSICAL_READS | USER_ROLLBACKS |
| DB_TIME | PHYSICAL_WRITES | SESSIONS_COUNT |
| EXECUTE_COUNT | PHYSICAL_READ_BYTES | SHARED_POOL_SIZE |
| HOST_CPU | PHYSICAL_WRITE_BYTES | SHARED_POOL_FREE_MEM |
For example, these two statistics can’t be displayed because their related API functions don’t match IN arguments or output format:
| REDO_SWITCHES | requires arguments that don’t match (BEGIN_SNAP, END_SNAP, INSTANCE) |
| QUERY_STATS | returns rows that don’t match (SNAP_ID, SNAP_DATE, VALUE) |
Refer to “Add a chart” section or to the “d.side Interactive Replay API guide” for more details about these statistics or API functions.
ADD_TOP_SQL procedure #
This procedure is executed to have the top SQL queries list to be part of the report.
Syntax
DSIDE_REPORT.ADD_TOP_SQL(
  top IN NUMBER
);
Parameters
| Parameter | Description |
|---|---|
| top | How many SQL queries will be displayed in the list Default: 10 |
For more details, refer to “Add a list” section.
ADD_TOP_WAIT_EVENTS procedure #
This procedure is executed to have the top wait events list to be part of the report.
Add in report the list of main wait events based on the time waited during the report period.
Syntax
DSIDE_REPORT.ADD_TOP_WAIT_EVENTS(
  top IN NUMBER
);
Parameters
| Parameter | Description |
|---|---|
| top | How many wait events will be displayed in the list Default: 10 |
For more details, refer to “Add a list” section.
GENERATE_REPORT procedure #
This procedure is executed at the end of a reporting script, to get rows from REPLAY schema, in order to generate the HTML report lines, including chosen charts and lists.
Syntax
DSIDE_REPORT.GENERATE_REPORT(
  report_name IN VARCHAR2
);
Parameters
| Parameter | Description |
|---|---|
| report_name | Optional argument, if you want for example to regenerate a report that has already been stored in DS$REPORTS table. Default: NULL, meaning the report to be generated is the one previously initialized with INIT_REPORT procedure in the current Oracle session. |
As this procedure relies on DBMS_OUTPUT.PUT_LINE commands, serveroutput option must be set in sqlplus before running GENERATE_REPORT, otherwise the procedure will have no effect and the report will be empty.
Refer to the Sample script to see an example of usage.
GET_REPORT_LINES function #
This procedure is executed at the end of a reporting script, to get rows from REPLAY schema, in order to generate the HTML report lines, including chosen charts and lists.
Syntax
DSIDE_REPORT.GET_REPORT_LINES(
  report_name IN VARCHAR2
)
RETURN LIST_OF_VARCHAR;
Parameters
| Parameter | Description |
|---|---|
| report_name | Optional argument, if you want for example to regenerate a report that has already been stored in DS$REPORTS table. Default: NULL, meaning the report to be generated is the one previously initialized with INIT_REPORT procedure in the current Oracle session. |
When generating again a report that has already been stored in DS$REPORTS table (for example the report named “report.142”), both following writings are valid:
select DSIDE_REPORT.GET_REPORT_LINES('report.142') from dual;
select * from DSIDE_REPORT.GET_REPORT_LINES('report.142');Example: complete generation of a report, using its name:
variable jobname VARCHAR2(64);
begin
  :jobname:=DSIDE_REPORT.INIT_REPORT(TRUNC(SYSDATE-1));
  DSIDE_REPORT.ADD_CHART('PHYSICAL_READS');
  DSIDE_REPORT.ADD_CHART('SHARED_POOL_FREE_MEM');
  DSIDE_REPORT.ADD_TOP_SQL();
commit;
end;
/

set linesize 1000 pagesize 0 trimspool on feedback off
spool report-lastday.html
select * from DSIDE_REPORT.GET_REPORT_LINES(:jobname);
spool off
Convert HTML report to PDF #
To easily share your report, use one of these three ways:
– package report.html with required files (java scripts and images) in a zip archive, or
– generate an autonomous report.html file including java scripts and base64 images, or
– generate a PDF file.
The best and easiest way to generate a PDF from an HTML report is to open the HTML report in a browser, then print the document with standard “Print to PDF” feature. Just ensure the “background graphics” option is enabled in “more settings”.
Reporting package upgrade #
To upgrade your DSIDE_REPORT package version to the latest available in your d.side distribution, just connect with your Replay schema user, and execute the same dsreport.sql script as the one used during installation step:
@dsreport.sqlSupport #
Any question or suggestion, feel free to contact d.side software support, from your customer space.
Before sending any request to d.side software support, please check what version of Reporting package you are running:
SELECT DSIDE_REPORT.GET_PACKAGE_VERSION FROM DUAL;A screenshot of the « About » window available from d.side « Help » menu, including version number, Product ID and environment info, can be useful as well.


